Six instructors from various divisions and departments participated in a new Data Driven Design: Quercus Analytics (D3:QA) initiative for 2021-22, funded by the Vice-Provost, Innovations in Undergraduate Education (VP-IUE).
The D3:QA initiative, facilitated by ITS’ Digital Learning Innovation, extended course design programming to examine opportunities provided by the Quercus New Analytics module.
Participating Instructors
- Stavroula Andreopoulos (Temerty Faculty of Medicine)
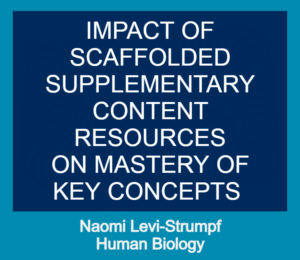
- Naomi Levy-Strumpf (Faculty of Arts and Science – Human Biology)
- Naomi Steenhof (Leslie Dan Faculty of Pharmacy)
- Chirag Variawa (Faculty of Applied Science and Engineering)
- Pooja Vashisth (University of Toronto Mississauga – Mathematical and Computational Science)
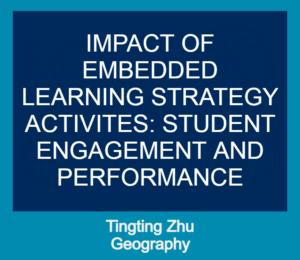
- Tingting Zhu (University of Toronto Mississauga – Geography, Geomatics and Environment)
These pioneers explored the use of student data to make design decisions in hybrid and online courses, meeting quarterly over the course of 12 months for facilitated workshops and consultations related to extracting and making meaning of Quercus data patterns. Instructors participated in a peer network that facilitated capacity development with regards to extracting (data exports and log files) and making meaning (assessing and applying data) of Quercus analytics. The network also supported the instructors in planning course design elements informed by the available data, implementing changes, and reflecting on the impacts.
The instructors have:
- Received support with identifying the available data, analyzing the data and exploring how data informs the redesign process.
- Provided progress updates of challenges and successes working with the data as applied to their inquiry question(s).
- Cohort participants have benefitted from support in use of analytics data downloaded from New Analytics reports [log files] through consultation and collaboration with learning analysts who have prepared reports and visualizations.
- Using this analytics data, instructors are identifying areas for consideration in future course re/design decisions and interventions.
To see the details of each project please select from tiles below:
 |
 |
 |
 |
 |
 |
Additional Resources
Are you interested in working with course activity reports from Quercus analytics? Download our pdf guide explaining how to download the Quercus course activity report. The guide explains the steps to download the course activity report for published courses as CSV files as well as provides a ‘data dictionary’ which outlines the CSV categories and columns with descriptions.
For more information on learning analytics at U of T contact digital.learning@utoronto.ca
