Updated November 04, 2022
The Data-Driven Design: Quercus Analytics (D3:QA) initiative for 2021-2022 has come to its completion. On October 28 we held a 90 minute online synchronous event to showcase the work of each instructor. Instructors were given 10 mins to present a high-level overview of their work as well as 5 mins for a short Q&A session. The event was well attended (with over 50 participants) and a feedback survey administered after the event demonstrated a high level of satisfaction from participants (100% responded ‘very satisfied’). There is also a dedicated D3:QA showcase web page that summarizes each instructor’s work as well as provides a full report of their data analysis over the past year.
Instructors involved in the 2021-2022 D3:QA initiative participated in a peer network that facilitates capacity development with regards to extracting (data exports and log files) and making meaning (assessing and applying data) of Quercus analytics. The network also supported the instructors in planning course design elements informed by the available data, implementing changes, and reflecting on the impacts.
The six lead instructors in this cohort were from various divisions and departments, including:
- Stavroula Andreopoulos (Medicine)
- Naomi Levy-Strumpf (Faculty of Arts and Science – Human Biology)
- Naomi Steenhof (Pharmacy)
- Chirag Variawa (Faculty of Applied Science and Engineering)
- Pooja Vashisth (UTM – Computer Science)
- Tingting Zhu (Faculty of Arts and Science – Geographic Information Systems)
An important outcome of this project has been additional adaptable examples of Quercus data use to be shared across U of T to advance instructional design and implementation processes. Areas of need for further development related to learning analytics are also being identified.

Activities
- Instructor participation in quarterly meetings to support the redesign process.
- Support in access and use of analytics data from log files by learning data analysts who help with preparation of reports.
- Identification of areas of redesign in courses using analytics data to inform their design decisions.
Deliverables
- Instructor project reports evaluating impact of access to analytic data
- Participation in showcase of examples of use of analytics by instructors
- Course [re]design plans across varied modes of course delivery
- Contribution to articulation of future Quercus instructor dashboard requirements
Update – July, 05, 2022
The 2021-22 D3QA Initiative is now past the mid-point of planned program activity.
Instructor activities have been as follows:
- All participants joined in our orientation session meeting in December 2021 and two quarterly workshops in 2022.
- Instructors in the cohort have:
- received support with identifying the available data, analyzing the data and exploring how data informs the redesign process.
- provided progress updates of challenges and successes working with the data as applied to their inquiry question(s).
- Cohort participants have benefitted from support in use of analytics data downloaded from New Analytics reports [log files] through consultation and collaboration with learning analysts who have prepared reports and visualizations.
- Using this analytics data, instructors are identifying areas for consideration in future course re/design decisions and interventions.
Example Data Explorations:
Here we share brief updates from three instructors in the cohort. Full reports and showcasing of material will follow in Fall 2022.
Instructor: Naomi Levy-Strumpf
Course: Introduction to Fundamental Genetics and its Applications provides a comprehensive introduction to key therapeutic approaches including gene therapy, CRISPR-based gene editing, epigenetic manipulations & regenerative medicine.
Inquiry Question: Given the variety of preparatory material (mandatory lecture notes and study guides), it was still unclear if the students were effectively accessing the different resource types and whether this engagement was associated with the weekly quizzes’ performance. Naomi researched how students are engaged, measured by the number of views and timing of access to the mandatory lecture notes and study guide (associated with quiz scores).
The image below shows that students who were Not Cramming the Study Guide had the highest median score, followed by students who were Cramming the Study Guide, and students that were not viewing the material.
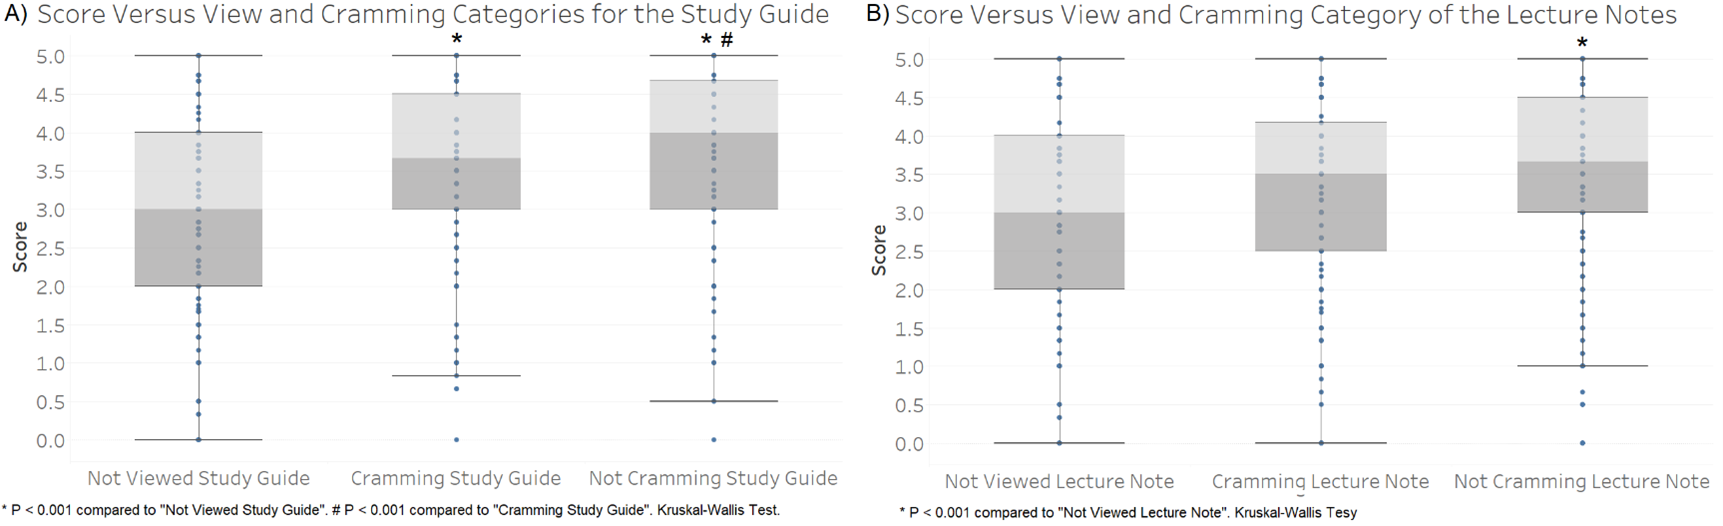
Initial Findings: The Study Guide may be a key resource related to higher quiz scores, and students who accessed this resource in advance had a better performance compared to the ones that accessed the material closer to the deadline.
—
Instructor: Chirag Variawa
Course: Introduction to Engineering previews the core fields in engineering through guest presentations. Class sessions are used to help undeclared first-year students develop personal goals and understand the major fields of engineering; the curriculum, areas of study, and career opportunities
Inquiry Question: Do students change their minds about their discipline of choice as they progress through the course? If so, to what degree? Reflective questions about the seminar session were administered weekly.
The image below shows the variations with students’ first choice of program.
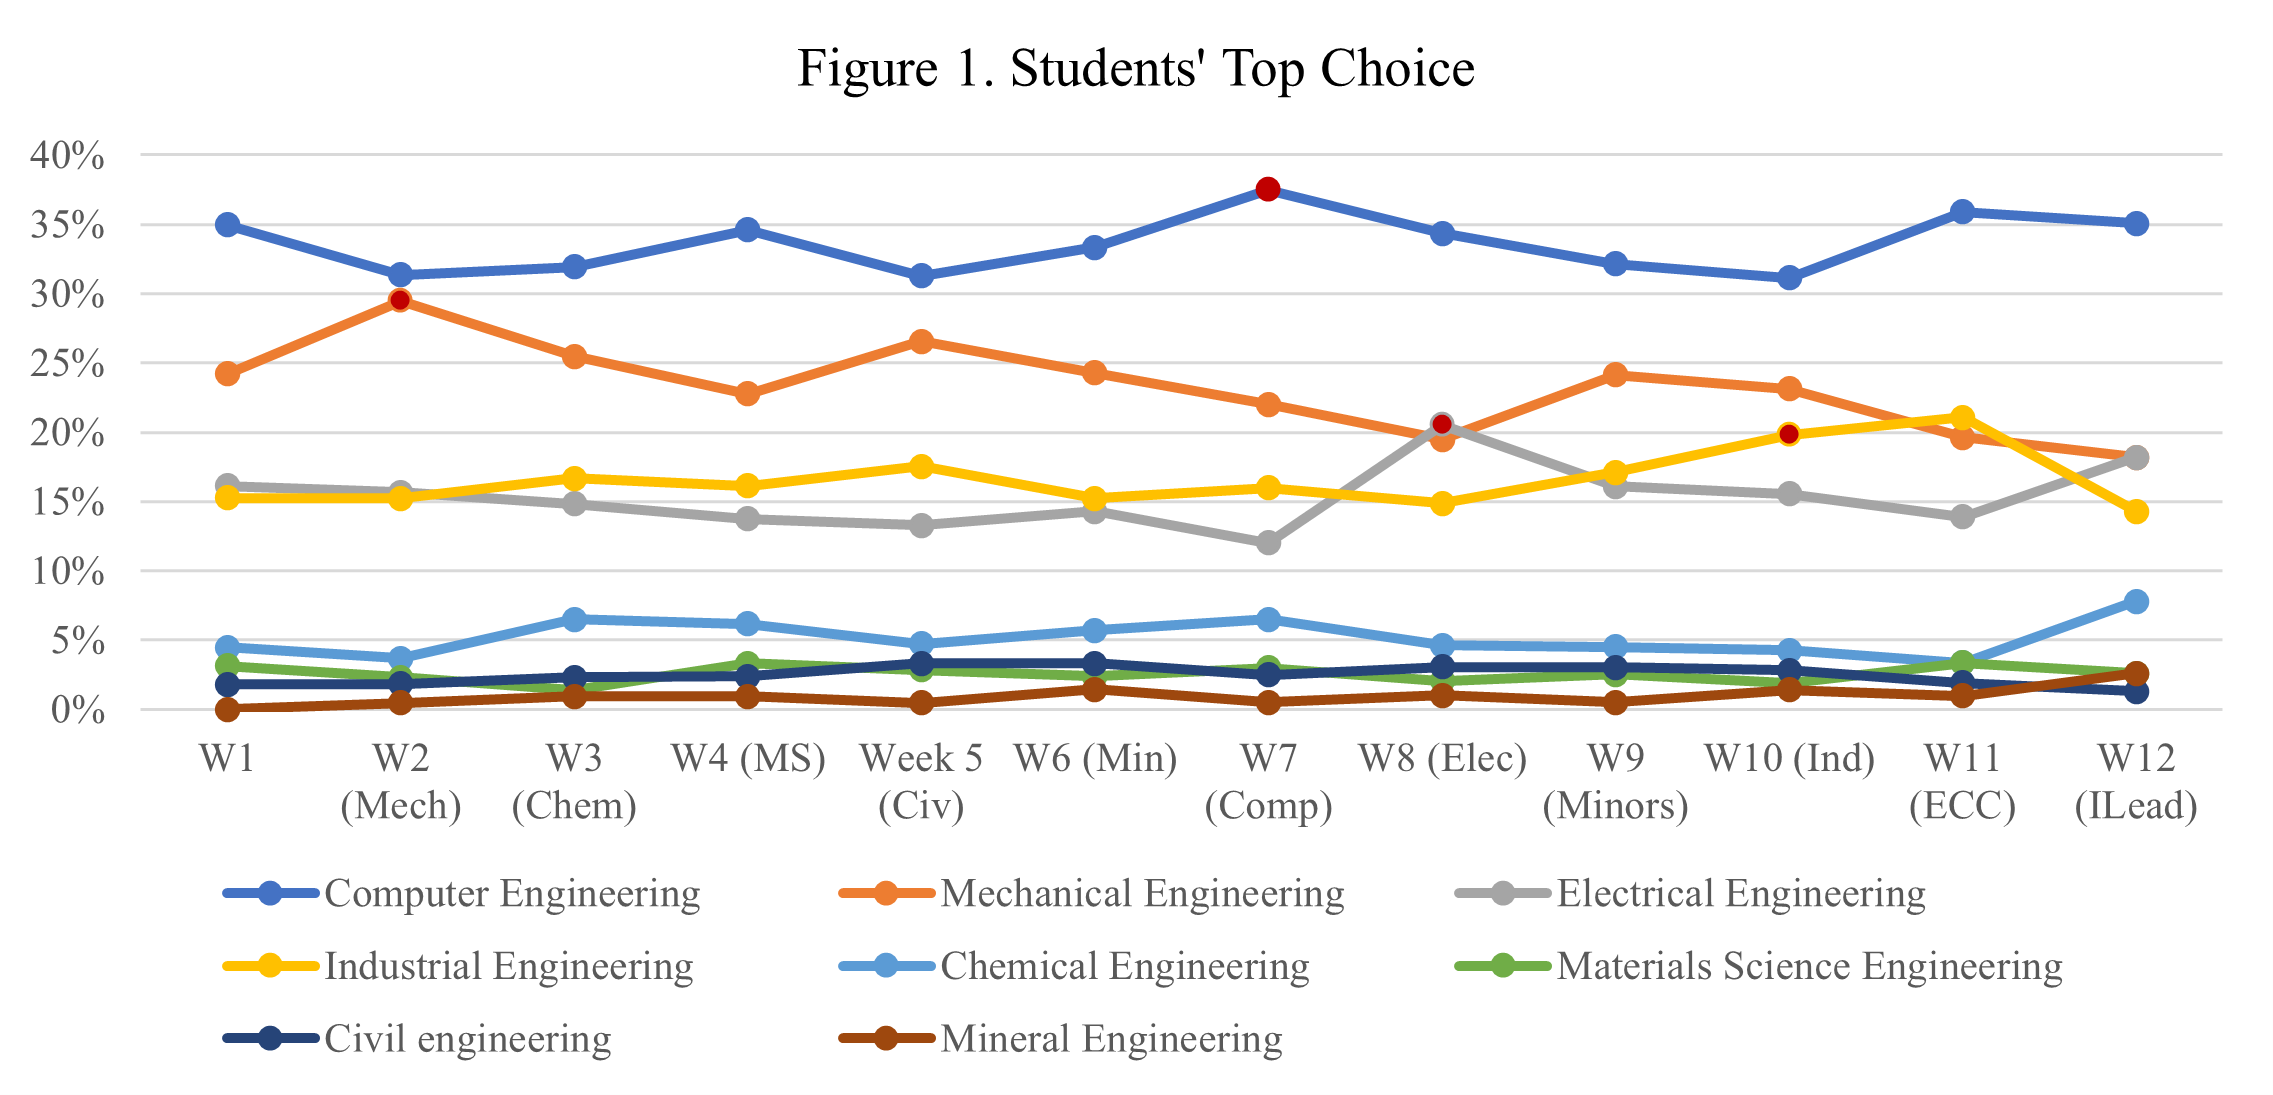
Initial Findings: First-year engineering students’ choice of programs varied and shifted throughout the term as they got to know more about these programs. The work is being extended to explore language analysis in written responses, such as positive and negative sentiment analysis.
—
Instructor: Pooja Vashisth
Course: Computer Organization is an introduction to computer organization and architecture.
Inquiry Question: Each week, recommended readings and a quiz are posted. This analysis aimed to assist with spotting concepts which students were struggling with mid-course or earlier, offering a proactive chance to provide supplemental resources to improve their chances of success. Analysis included tracking student views of material as well as the percentage of students that accessed the reading material before each quiz deadline.
The image below shows that every week the number of views of the reading material started to increase on Monday and has a peak on Wednesday, with an occasional extension of this peak through Thursday (the class date and deadline for the quizzes).
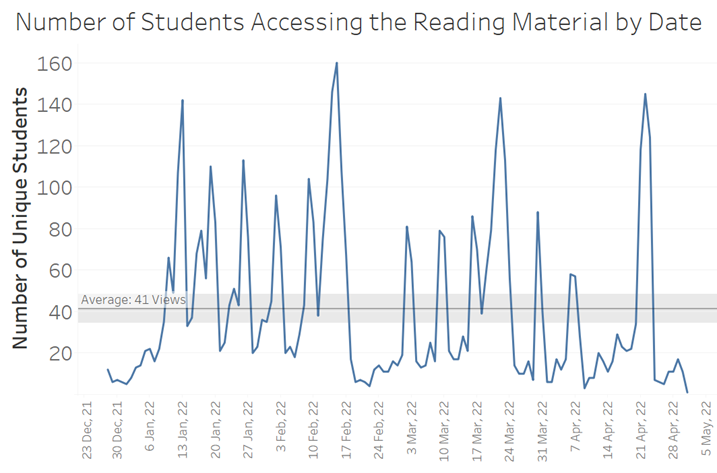
Initial Findings: With the identification of the quizzes and questions that the students may be struggling with the most, the instructor can identify key concepts related to these quizzes and review them before the term tests and final exam. This would also help the instructors to redesign the quizzes to better achieve these goals.
Progress and Insights:
Our work in data-driven design using Quercus data has accelerated with the addition of two Learning Data Analysts to our support team:
- Alan da Silveira Fleck – Learning Data Analyst, Centre for Teaching Support & Innovation
- Qin Liu (Senior Research Associate, Institute for Studies in Transdisciplinary Engineering Education & Practice (ISTEP))
Working shoulder-to-shoulder with these analysts, the current cohort of instructors in the D3:QA program have been able to dive deeper into log file data for the full winter semester, and benefit from more advanced analysis and visualization tools. It is anticipated that future work in this domain will leverage Microsoft Power-BI tools that are now being supported at UofT.
The process of identifying reporting needs, extracting data and creating analytic reports and visualizations has been an iterative process, with both instructors and the project team benefiting and learning together. In addition to the benefits for enhancement of course design, we are also identifying reporting requirements, data sets and filters that are a priority for the instructor-facing dashboard project also underway as part of the Learning Analytics program of activities.
Project Team
- Will Heikoop – Coordinator, Digital Learning Innovation
- Laurie Harrison – Director, Digital Learning Innovation
- Alan da Silveira Fleck – Learning Data Analyst, Centre for Teaching Support & Innovation
- Qin Liu – Senior Research Associate, Institute for Studies in Transdisciplinary Engineering Education & Practice – ISTEP
Contact digital.learning@utoronto.ca for more information.