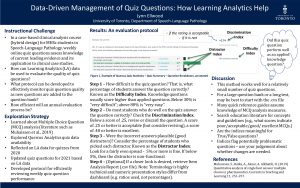
Lynn Ellwood
Course/ProgramSLP2500Y – Advanced Internship |
 Poster and Video Presentation – Teaching and Learning Symposium, May 2021 Poster and Video Presentation – Teaching and Learning Symposium, May 2021 |
Design Context
Principles of Integrated Course Design (Fink, 2005) promotes alignment of assessments with learning activities. This project addresses the quality of quiz questions in an advanced clinical analysis course that is designed to help health profession students in their final academic semester develop and demonstrate emerging competence associated with professional roles of Knowledge Expert and Clinical Expert (CAASPR, 2018). An entry-to-practice clinician is expected to “Integrate current leading evidence and clinical reasoning in clinical practice.” This course uses a hybrid design in which students complete pre-lecture required readings and applied learning activities for each of 5 case studies. Each e-learning module includes three short quizzes of 3-5 questions, including both knowledge questions (current leading evidence) and applied knowledge questions (clinical reasoning). Most questions are single answer multiple choice questions (MCQs).
Fink, L. D. (2005). Integrated Course Design. The IDEA Center Manhattan, Kansas
The Canadian Alliance of Audiology and Speech-Language Pathology Regulators (CAASPR), 2018. The National Audiology and Speech-Language Pathology Competency Profiles.
Instructional Challenge
Do quizzes function as designed? Are knowledge questions about the required readings clear and understandable? Do students who do the expected level of deep reading perform well? Do the questions discriminate such students from those who skim read or make unlucky guesses? Do applied discriminate between students who apply sound clinical reasoning and those who struggle in this area or don’t apply themselves to the task?
As course instructor, I wished to explore:
- How can Learning Analytics (LA) data be used to evaluate the quality of quiz questions?
- What protocol can be developed to effectively monitor quiz question quality as new questions are added to the question bank?
- How efficient will an annual evaluation process be?
Design Strategy
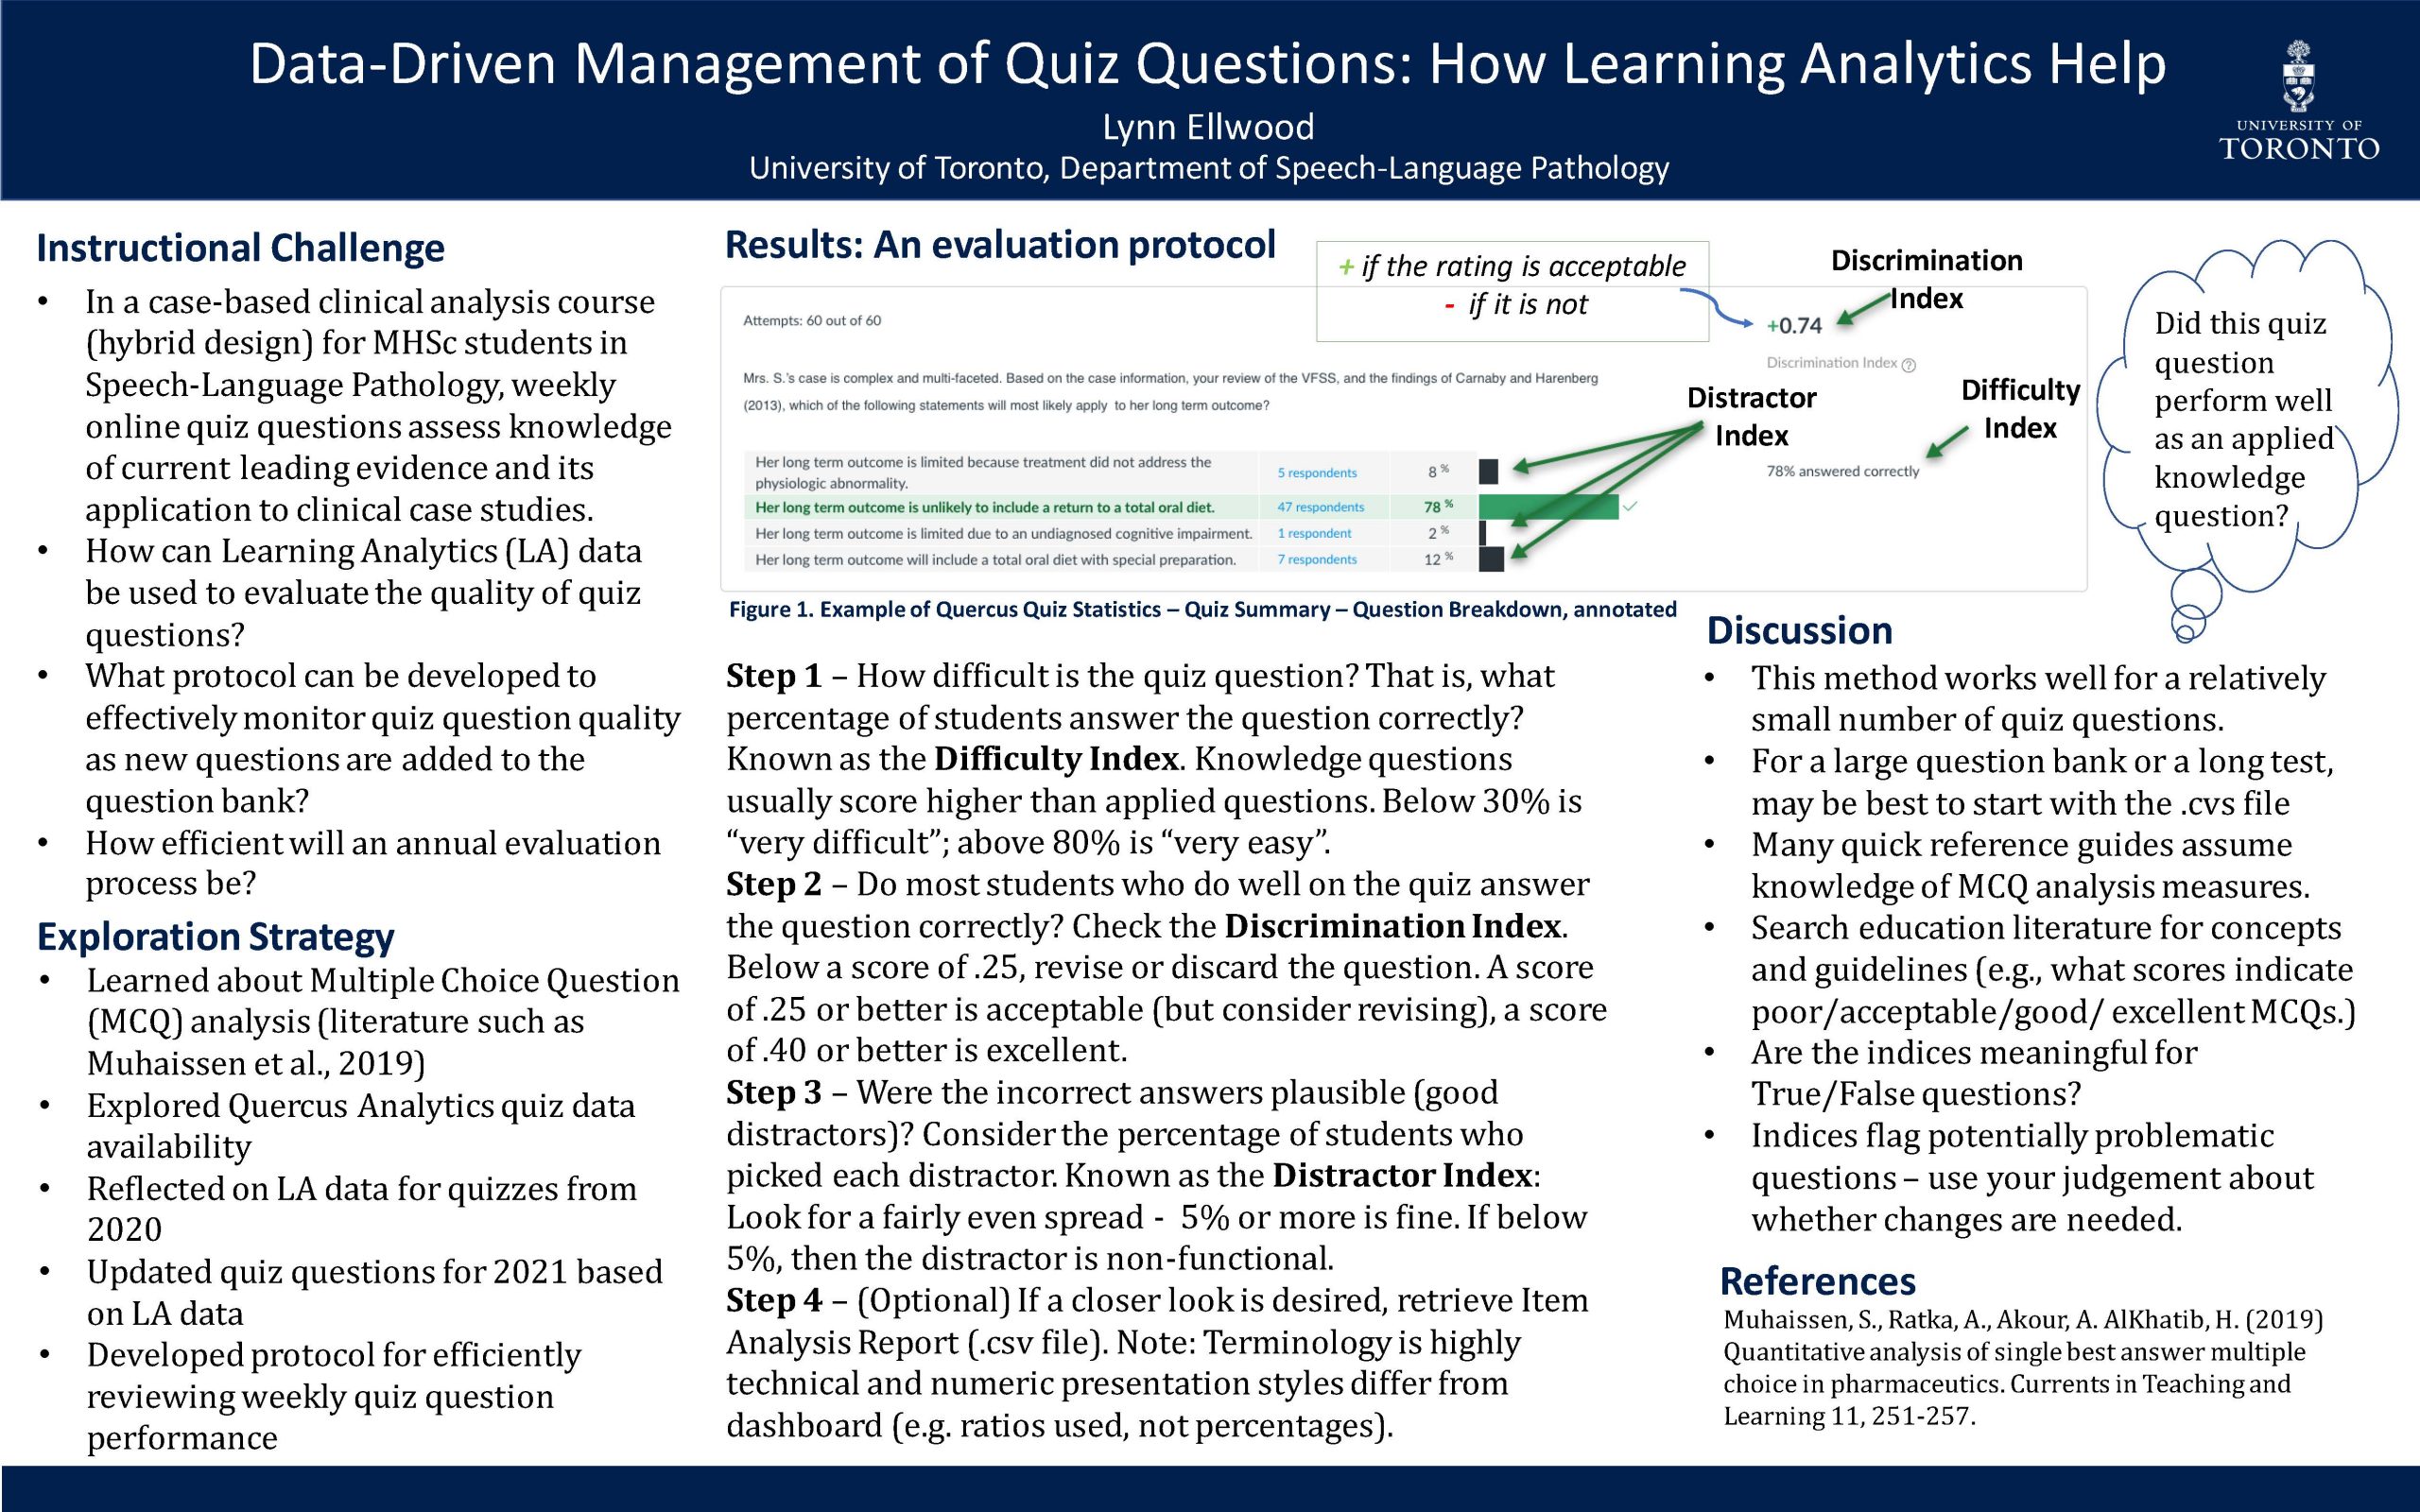
In 2021, the course instructor reflected on LA data for quizzes the prior year and updated quiz questions based on LA data. A protocol was developed for quickly and easily checking weekly quiz question performance. Once the concepts were understood and the corresponding indicators were identified on the Quiz Summary dashboard, a bit of practice made the process quick and easy.
Step 1
How difficult is the question? That is, what percentage of students answer the question correctly? Check the Difficulty Index.
Step 2
Do most students who do well on the quiz answer the question correctly? Check the Discrimination Index. Below a score of .24, revise or discard the question. A score of .24 or better is acceptable (but consider revising), a score of .40 or better is excellent.
Step 3
Were the incorrect answers plausible (good distractors)? Look at the percentage of students who picked each distractor. Look for a fairly even spread. 5% or more is fine. If below 5%, then the distractor is non-functional.
Finding clear concise and useful information in the CANVAS resources was difficult; the scant information there assumed a lot of prior knowledge about MCQ analysis. Guidance documents in other university resource archives were similarly opaque.
Delving into educational literature was helpful. Muhaissen et al. (2019), for instance, provide an extensive analysis of a large bank of pharmaceutics exam questions using a wide range of indices. Though somewhat different terminology was used (such as Distractor Efficiency rather than Distractor Index), concepts were clearly explained, providing a helpful knowledge base. The authors emphasized that potentially problematic MCQs can be flagged through classification by indices of difficulty, discrimination and distractor efficiency, but that exam writer judgement must be exercised. Based on extensive literature, they suggest ranges of question scores that indicate poor, acceptable, good and excellent questions.
Muhaissen, S., Ratka, A., Akour, A. AlKhatib, H. (2019) Quantitative analysis of single best answer multiple choice in pharmaceutics. Currents in Teaching and Learning11, 251-257.
Use of Data to Inform Design Iteration and Instruction
All quiz questions pulled from the question bank for re-use in 2021 were analysed and revised if deemed necessary prior to deployment. For a new case study presented in 2021, new quiz questions were shown to performed satisfactorily based on the Difficulty Index and the Discrimination Index, though the Distractor Index showed that distractors could be improved for many questions. In one instance it was helpful to go to the .csv file. The Discrimination Index was high (+0.75), though only 47% got the question correct while 47% selected only one of the three distractors. Why was the Discrimination Index so high when the question appeared to perform at close to a 50:50 chance level? The detailed Item Analysis Report showed that all of the “top students” got the question correct. The question was retained in the question bank, though distractors will be re-examined for the 2022 iteration of the quiz.
Next Steps
The simple three-step quiz question analysis process will be applied on an annual basis as a quick and easy means of quality control. Where feasible, distracters will be improved. The quality of new questions added to the question bank will be verified once deployed. Consideration will be given to eliminating multiple correct answer MCQs, as meaningful LA data is not available for analysis for these types of questions. The question of whether LA data is meaningful for True/False questions will be explored.
I would also like to explore characteristics of students in the top, middle, and low groups. How much time do they spend with the study material, for example. For students who get knowledge questions wrong, does time data suggest they care skim reading and guessing?
Looking forward to diving into Quercus Analytics more.
Poster
Presented at the Teaching and Learning Symposium, May 2021.
Click to download poster PDF in a new tab