Hedieh Najafi and Laurie Harrison
University of Toronto
July 2021
Return to D3:QA main page | Full Report – PDF Download
Objectives of the D3:QA Project
In fall 2019 the Office of Vice Provost, Innovations in Undergraduate Education issued a call for U of T instructors to participate in an Online Undergraduate Course Initiative (OUCI) focused on design of online or hybrid courses informed by course data available through Quercus Learning Management System (LMS). Instructors joining the Data Driven Design: Quercus Analytics cohort (D3:QA) participated in a series of capacity development activities to enable course design and implementation, and subsequently, to share the results of their data driven course design projects openly with the wider U of T community.
The New Analytics tool in Quercus is available to all instructors at U of T who teach their courses using Quercus and provides interactive reports on students’ grades and participation. Informed by these data, and Quercus additional course data and reports, it is possible for instructors to identify course components and activities that once revised, could improve students’ learning experiences. A literature scan showed few frameworks for understanding how instructors use such data in course design and what support structures are needed to facilitate data driven design efforts (Bakharia et al., 2016; Dazo et al., 2017; Wise & Jung, 2019). In order to garner insight and expand institutional capacity for support of instructors in this domain, the D3:QA project targeted three main goals related to use of course learning data:
- Explore online learning strategies that transform instruction and enhance learner experience
- Create a peer network cohort model to build instructor capacity in accessing and applying data driven methods to course design
- Collect and share exemplary design processes that leverage access to Quercus learning analytics data that can be adapted and applied to other courses
This report describes D3:QA cohort composition, capacity development activities, and insights gleaned from the design and implementation process. The report concludes with a summary of insights to inform future data driven course design initiatives.
D3:QA Organizing Team and Instructor Cohort
The Digital Learning Innovation portfolio (formerly, Online Learning Strategies), with additional support from the manager of Educational Innovation & Academic Initiatives (UTSC), organized the Data Driven Design: Quercus Analytics program spanning from 2019 to 2021. The organizers coordinated the administrative tasks of the cohort, delivered workshops and webinars, and provided ongoing consultation to the cohort of instructors who joined the D3:QA cohort.
Ten instructors joined the D3:QA cohort representing eight departments. Out of 10 courses that the participating instructors proposed for (re)design, three were undergraduate level and the remainder were graduate level courses. Anticipated course enrolment ranged between 20 to over 400 students. Table 1 presents a summary of D3:QA cohort information. Note that all courses listed in Table 1 were offered online in 2020 and 2021 due to COVID-19 restrictions irrespective of their initial intended format being hybrid or online.
Deliverables of the D3:QA projects included course profiles shared on Open UToronto website and an invited poster session at the 2021 U of T Teaching and Learning Symposium.
Table 1. D3:QA cohort information
| Instructors | Title | Faculty/Department | Course Name | Class Size |
| Laura Dempster | Associate Professor | Dentistry | Communication Skills (DEN202Y) | 120 |
| Andrea Duncan | Assistant Professor, Teaching Stream | Occupational Science and Occupational Therapy | Occupational Therapy Professional Practice 3 (OCT1233H) | 130 |
| Lynn Ellwood | Associate Professor, Teaching Stream | Speech-Language Pathology | Advanced Internship (SLP2500Y) | 60 |
| William Ju | Associate Professor, Teaching Stream | Faculty of Arts and Science | Neurobiology of Behaviour (HMB300)*
Neurobiology of the Synapse (CJH332)* |
450-500 |
| Sandra Mejia | Assistant Professor, Teaching Stream | Leslie Dan Faculty of Pharmacy | Pharmaceutical Calculations (PHM 130) | 240 |
| Safieh Moghaddam | Assistant Professor, Teaching Stream | Language Studies, UTCS | English Grammar (LINB18)* | 150 |
| Karen Mundy | Professor | Leadership, Higher, and Adult Education | Doctoral Seminar on Policy Issues in Education (LHA3041) | 20 |
| Jessica Pressey | Assistant Professor, Teaching Stream | Faculty of Arts and Science | Neurobiology of Behaviour (HMB300)*
Neurobiology of the Synapse (CJH332)* |
450-500 |
| Heather Thomson | Assistant Professor, Teaching Stream | Lawrence S. Bloomberg Faculty of Nursing | Program Planning and Evaluation in Nursing (NUR1157) | 32 |
| Kathy Vu | Assistant Professor, Teaching Stream | Leslie Dan Faculty of Pharmacy | Contemporary Topics in Oncology (PHM653) | 234 |
*Undergraduate level course
Timeline
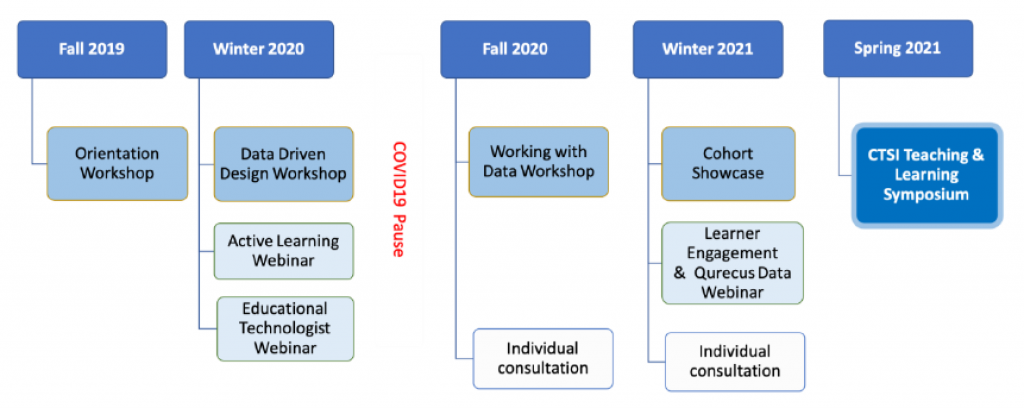
D3:QA cohort was scheduled to start its activities in fall 2019 and to culminate with a cohort showcase in fall 2020. In response to significant disruption to U of T operation caused by the COVID-19 pandemic, the cohort paused its activities mid-spring 2020 and resumed activities in fall 2020. Figure 1 shows the actual timeline of D3:QA cohort activities.
Figure 1. D3:QA project timeline
D3:QA Cohort Programming
Instructors who joined the cohort participated in four quarterly workshops and three optional webinars. Between workshops, the organizing team communicated regularly with the instructors and, towards the end of the projects, provided one-on-one consultations. The D3:QA project instructor capacity building activities were based on an adapted four-stage data driven course design cycle (Wise & Jung, 2019):
- Stage 1: Formulating inquiry questions
- Stage 2: Interpret data that informs the inquiry questions
- Stage 3: Taking data informed action to address the inquiry question
- Stage 4: Reflecting on the effectiveness of the design process
For a schematic of the data informed design cycle, see Appendix A.
Capacity Building Activities
As shown in Figure 1, the organizing team planned three types of capacity building activities for the D3:QA cohort to provide support for curriculum design and making sense of Quercus data, and to maintain a community of practice for the duration of the project: interactive task-focused workshops, short webinars, and individual consultations.
Interactive workshops
D3:QA instructors participated in four workshops between fall 2019 and winter 2021. Workshops were originally planned to be offered in-person, however, after COVID-12 closures they were offered online. Below, we summarize the goal of each workshop. For a detailed description, please see Appendix B.
- Workshop 1: In this introductory workshop goals of the D3:QA project and its expected outcome were discussed. Instructors reviewed examples of instructional challenges and how Quercus data could be used to address them. A Backward Design framework was introduced to guide course (re)design process (Fink, 2005).
- Workshop 2: Using an example from their courses, instructors examined the alignment among learning objectives, learning activities, and assessment. They, then, discussed the reciprocal relation between available Quercus data and their instructional challenge.
- Workshop 3: In this first online workshop after the COVID-19 pivot, instructors examined how the shift to fully online/remote courses affected their course design. Dimensions of student engagement and data that provide evidence of engagement were discussed. Using an existing case, the organizing team explained how Quercus data can be managed and transformed into data that is applicable to instructional challenges.
- Workshop 4: Instructors shared and discussed their design with peers in preparation for finalizing their course profile and poster presentation.
Webinars
n the first webinar offered to D3:QA instructors, participants discussed ways to support a community of inquiry in their courses and to integrate active learning strategies in their course design. The second webinar examined analytical approaches to interpret Quercus New Analytics data on learner-content engagement. In a special webinar designed for the educational technology professionals, educational technology staff from the instructors’ home departments reviewed Quercus course data and reports and examined their role in accessing course data.
Individual Consultations
As the planned D3:QA program approached its end, the organizing team provided one-on-one support to the instructors as a supplement to group activities. In these online consultations, questions and concerns related to course design, data access and analysis, and project deliverables were discussed.
Insights From the D3:QA Project
The organizing team conducted an evaluation project to review the processes of data driven design and implementation, to highlight opportunities for data driven design beyond the D3:QA cohort, and to identify areas of improvement. The evolving impact of COVID-19 on instructors’ data driven design project and their courses is a distinct theme beyond the original scope, also explored in the evaluation process. The evaluation draws on D3:QA instructor’s digital journals, worksheets from workshops and webinars, meeting notes, and course design showcase documents. Insights included in this report are provided anonymously and at an aggregate level.
Quercus Data Used in Course (re)Design
A complete description of instructional challenges, design approach, and data used for each D3:QA project is included within individual course profiles on the D3:QA Showcase site. Available Quercus course data and reports are summarized along with frequency of use across all D3:QA projects in Table 2.
Table 2. Quercus data sources and how often they were used in course (re)design
| Data Source | Details | Frequency of Instructor Use |
| Course grade |
|
2 |
| Weekly online activity |
|
4 |
| Student Activity |
|
4 |
| Reports |
|
3 |
| Quiz statistics |
|
4 |
| Communication with instructors |
|
1 |
| Other/Custom |
|
3 |
Depending on their design challenge or inquiry interest, D3:QA instructors selected data sources available directly through Quercus New Analytics tool and reports. Some instructors also used additional data including surveys and polls to collect learners’ feedback on course resources and on methods of communication and group work. Yet other instructors extracted data on learner access of platforms integrated into the Academic Toolkit, such as Bb Collaborate and Office 365 document sharing. These data were not always available in standard instructor reports provided within Quercus and required an extra administrative support for data access and extraction process.
For a complete list of Quercus course data and reports, please see Appendix C.
Implementing Data Driven Design
While in some cases course design plans needed adjustments due to the implications of COVID-19 for hybrid courses, all D3:QA instructors successfully implemented their courses at least once within the timeline of the project. Some instructors completed all four steps of data driven course design. Others implemented the designed course and collected data but due to timing of their course, plan to conduct further analysis and redesign after conclusion of D3:QA project activities.
Overall, D3:QA instructors found their course (re)design successful based on their design goals. In most cases Quercus course data, including New Analytics data, and reports provided sufficient evidence to assess the effectiveness of design interventions. For example, instructors who used quiz statistics were satisfied with its utility and could use quiz statistics and test item analysis data to revise their question bank for the next offering of the course. Alternatively, the instructor could provide just in time support for certain course topics based on students’ responses to quiz questions on those course topics.
Impact of COVID-19 on D3:QA Projects
After a five-month hiatus while U of T community pivoted to online instruction, the organizers contacted D3:QA instructors to prepare a restart plan. Some of the instructors were continuing their design with minimal changes, yet others needed to examine the feasibility of their design for fully online courses and to revise the design as needed. The project resumed its program of activities in September 2020.
The impact of COVID-19 on course schedules and mode of delivery is still evolving even at the time of writing this report in 2021. However, the feedback from D3:QA instructors allowed us to garner insight into instructors’ experience in planning their courses and their significant challenges in an unprecedented and unpredictable situation.
Desired Learning Analytics Dashboard and Reports Features
Reflecting on their experience in the D3:QA cohort, the instructors identified desired LMS data, report functionalities, and access to integrated tools that are currently unavailable in Quercus.
- Customizable instructor-facing dashboard: Having explored Quercus New Analytics tool, D3:QA instructors explained how a more customizable dashboard would facilitate data selection for course (re)design or to monitor students’ activities. To facilitate monitoring students’ activity data through Quercus New Analytics, an instructor suggested adding the functionality of criteria-based autogenerated reports. Another request was for student data that are generated through various integrated platforms accessed via the Learning Tools Integration (LTI) standard to be available with Quercus data reports.
- Longitudinal Quercus data: Five instructors requested access to longitudinal Quercus data and the functionality to compare course data across different cohorts of students. Cross-cohort comparisons allows instructors to examine the effectiveness of course (re)design in different semesters. Longitudinal data facilitate monitoring a cohort as they progress through their degree program. Access to such longitudinal data, as one instructor explained, would also benefit the students as they can revisit previous learning activities and feedback associated with them as they apply their knowledge in new contexts.
- Data on sequences of students’ access to course components: Access sequence data show students’ movements among different course components. A complete chronological log of students’ access to different course components throughout the course, rather than the most recent access, provides insight into patterns and sequence of access that the instructor can use as a diagnostic tool. For instance, frequent access to a reading prior to an assignment or while completing an assignment may indicate that the topic needs further clarification.
- Interactive discussion forum dashboard: The ability to create a complete record of a student’s posts and responses in course discussion forums was another desired functionality of instructor facing dashboards. Contents of students’ posts and patterns of participation in different forums may reveal the extent of students’ use of learning strategies such as help-seeking.
- More granular learner engagement data: Instructors were interested in understanding students’ engagement with course components. Number of page views is an existing data point that Quercus analytics offer. However, according to some of D3:QA instructors, a proxy for time spent in course pages, documents, or videos would provide a more granular measure of learner engagement. Currently Quercus standard reports show aggregated data for weekly rather than daily page views. One instructor envisioned collecting interaction data such as mouse movements or scrolls to differentiate between active engagement with a course component vs. merely having a page open for an extended time.
Desired Quercus Tools
Some of the instructors suggested tools and functionalities to facilitate data driven course design:
- Mid-term survey tool: As one instructor suggested this tool would allow just in time course improvements based on students’ multi-week experience with the course.
- Course design documentation tools: Instructors could benefit from course design documentation tools integrated within Quercus. For example, the ability to categorize questions included in assignments and assessments would allow the instructors to maintain a desired proportion of questions that measure higher and lower order thinking in each course topic.
Desired Support
D3:QA instructors proposed two tiers of support for data driven course design: course design support and data interpretation support.
Course Design Support
During the D3:QA project, instructors reviewed and practiced with course design frameworks such as Backward Design. They also discussed using active learning strategies in their courses and brainstormed dimensions of learner engagement and identifying data to measure students’ engagement. However, some instructors showed interest in continued access to course design support typically offered by the Center for Teaching Support and Innovation and divisional teaching support units.
Accessing and Interpreting Learning Analytics Data
In D3:QA workshops and webinars, the organizing team discussed Quercus course data, including New Analytics dashboard, and course reports in multiple occasions. However, instructors expressed their concerns about confidence in accessing available data or making use of new data assets that will become available as Quercus is updated in the future.
D3:QA cohort members also emphasized that access to complex learning analytics data, such as quiz statistics, without the understanding of how to interpret them, could be a barrier in advancing effective data driven course design. In our conversations with D3:QA instructors, they inquired about existing data analysis support sources, similar to course design support that is offered by U of T teaching support units. After working with complex quiz data, one instructor pointed out how interpreting quiz statistics in Quercus required knowledge of analyzing multiple choice questions. This instructor researched the topic on their own.
In some cases, participants sought a more in-depth exploration of data informed design, requiring a higher level of specialized learning data access and report generation support than is generally available to U of T instructors. To address this need, one of the project team members with expertise in Quercus log file data formatting presented a webinar on using Excel pivot tables to manage and analyse course activity reports downloaded from Quercus. This session was well-received and at least two instructors requested further training and workshops on data management and analysis in Excel. Moreover, one of the D3:QA instructors continued to work on an expanded data informed course design project well beyond the scope of her anticipated deliverables. In other cases, the D3:QA team identified and suggested available sources for on-campus support where possible, including the CTSI SoTL hub. The demand for referrals for additional support signals an appetite for professional services in this domain.
Summary of Outcomes and Insights
Instructors who joined the D3:QA cohort used Quercus New Analytics tools and reports to (re)designed seven graduate level and three undergraduate level courses. The COVID-19 closures required all courses to be offered online at least up to fall 2021 semester, may have an impact on the format decisions for D3:QA intended for online or hybrid modalities when pandemic measures are lifted or reduced. All instructors in the D3:QA cohort successfully completed at least one cycle of course (re)design by the time the project came to an end.
To increase the reach of the D3:QA project beyond the participants, course profiles, posters prepared for the 2021 U of T Teaching and Learning Symposium, and complementary short videos on each D3:QA course have been published on Open UToronto website. Additionally, the D3:QA project team prepared a Quercus data interpretation guide for instructors who are interested in data driven design.
Based on their experience completing at least one cycle of data driven course design using Quercus New Analytics tool and reports, D3:QA instructors proposed additional dashboard features and functionality that will improve data driven design and instruction. These suggestions included a customizable dashboard, automated report generation, interactive discussion forum data dashboard, and more granular data on learner engagement.
Having access to resources on analyzing and interpreting Quercus New Analytics and downloaded report data was a recurring request for data-driven course design support. Such support could be provided through self-paced modules, self-directed resources, faculty development cohorts, or just in time consultations. While the potential for additional instructor support in the management, accessing, analysis, and interpretation of LMS data is still in an early stage of exploration at UofT, the insights gained through the D3:QA project affirm interest and need. This project serves as a first step in advancement of capacity development opportunities that can be sagaciously developed and implemented alongside course design support.
References
Bakharia, A., Corrin, L., De Barba, P., Kennedy, G., Gašević, D., Mulder, R., … & Lockyer, L. (2016, April). A conceptual framework linking learning design with learning analytics. In Proceedings of the sixth international conference on learning analytics & knowledge (pp. 329-338).
Dazo, S. L., Stepanek, N. R., Chauhan, A., & Dorn, B. (2017, May). Examining instructor use of learning analytics. In Proceedings of the 2017 CHI Conference Extended Abstracts on Human Factors in Computing Systems (pp. 2504-2510).
Wise, A. F., & Jung, Y. (2019). Teaching with analytics: Towards a situated model of instructional decision-making. Journal of Learning Analytics, 6(2), 53-69.
Fink, L. D. (2005). Integrated Course Design. The IDEA Center Manhattan, Kansas.
Wiggins, G., & McTighe, J. (2005). Backward Design. In Understanding by Design (2nd Ed., pp. 13-34). ASCD.
Appendices
Appendix A: D3:QA Data Informed Design Cycle
The D3:QA project instructor capacity building activities were based on an adapted four-stage data driven course design cycle (Wise & Jung, 2019):
- Formulating inquiry questions
- Interpreting data that informs the inquiry questions
- Taking data informed action to address the inquiry question
- Reflecting on the effectiveness of the design process
In the D3:QA context instructors were encouraged to enter at any point in the cycle, either beginning review of “Data” to inductively identify questions or patterns, or iterating on “Design” elements either before or during the instructional period to generate reflections and questions on the effectiveness of the course. Figure 2 shows a schematic of the D3:QA inquiry framework.
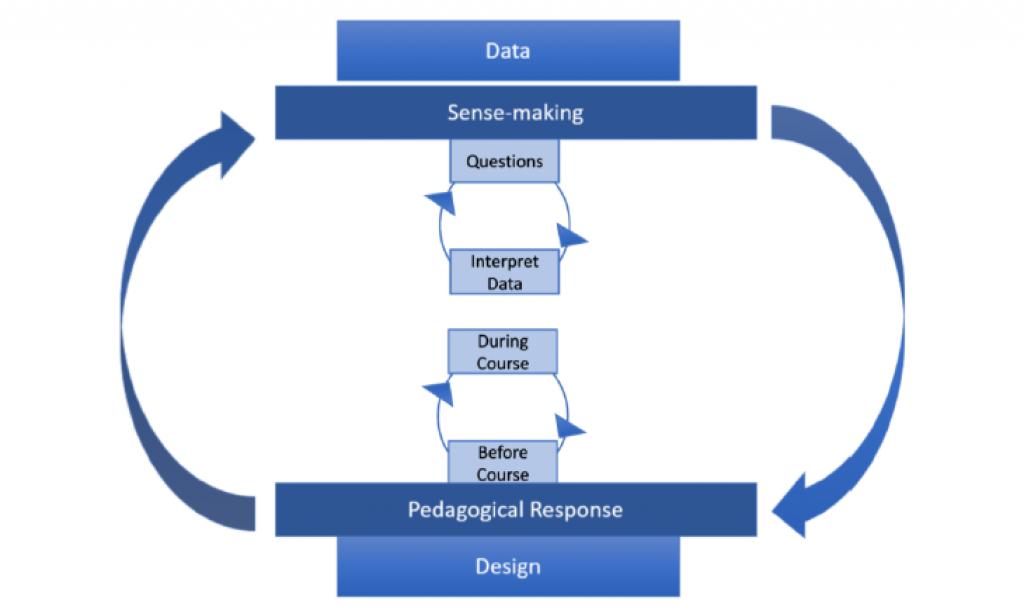
Figure 2. D3:QA inquiry framework adapted from (Wise & Jung, 2019) Instructor Experience Model
Appendix B: Workshop Description
Workshop 1: Orientation
- Pre-workshop activity: instructors used Fink’s framework (Fink, 2005) to identify an instructional challenge that aims for significant learning
- Instructors and organizers reviewed goals, timeline, and deliverables of the project
- Quercus New Analytics tool was introduced and examples of instructional challenge along with relevant Quercus data were discussed
- Instructors used a reflection prompt to outline their expectations of data informed course design
- Post-workshop activity: Informed by the pre-workshop activity, instructors used Backward Design framework to identify learning objectives, assessments, and learning activities and to align these components
Workshop 2: Data Driven Design
- Instructors revised their alignment component from Workshop1 post-workshop activity to:
- Refine assessment components and how Quercus data may inform formative and summative assessment design and refinement
- Increase opportunities for active learning
- Examine where support and scaffolds are needed
- Possible interactions between pedagogical goals and available Quercus data (e.g. improving interaction and learning; monitoring patterns of activity; identifying opportunities for targeted intervention, and redesign informed by previous iterations) were discussed.
- Instructors investigated two entry point to data informed design: starting with instructional challenge/question and identifying data that addressed the question; or reviewing available data to identify instructional questions that could be addressed with those data
- Post-workshop activity: Instructors created a first draft of their course map along with a sample course module.
Workshop 3: Working with Data
This online workshop took place after the COVID-19 related pause to cohort activities.
- Backward Design framework was reviewed
- Instructors discussed how they used Backward Design and course component alignment to pivot their courses online in response to COVID-19 closures
- Organizers led a discussion on dimensions of student engagement and ways to measure them. Instructors participated in a group activity to identify dimensions of engagement that they have already considered or that they would want to consider in their design.
- Adon Irani introduced Group Health Check tool as an example of how Quercus data can be transformed into learning analytic data
- Instructors revisited their design, also accounting for COVID-19 implications, to examine what data sources they were using for their instructional challenge and what data sources would be desirable to address their instructional challenge.
- Post-workshop activity: Instructors revisited their course map and created a sample course module.
Workshop 4: Online Cohort Showcase
Instructors shared their design with a peer and discussed the following:
- Context of the course
- How data informed design iterations and instruction
- Lessons learned to inform next design iterations
- Key message to share in U of T teaching and Learning Symposium poster
- Needs and gaps in support provided to instructor to use learning analytics
Appendix C: Quercus Course Data and Reports
The list of Quercus course data and reports is extracted from Quercus Support Resources on July 9th, 2021.
Course Level Reports
- Course Statistics
- Course Analytics
- New Analytics
- Student Interactions Report
Quercus Tools
- Grades
- Gradebook Data
- Quizzes
- Moderate Quiz
- Quiz Logs
- Quiz Statistics
- Quiz Analysis Reports
- Modules
- Progression through Modules
Individual Level Reports
- Student Analytics
- Access Report
- Interactions Report