Instructor’s Guide to Making Meaning from Available Data
Return to D3:QA main page | Instructor’s Guide PDF Download
This document provides a collection of techniques and strategies garnered through the D3 program activities that can be replicated by instructors in their own courses to make meaning of data available through the Quercus platform:
Getting started
1. Use “on-the-fly” synchronous knowledge checks
2. Using the standard dashboard to “View Course Analytics”
3. Enable “New Course and User Analytics” feature
Digging deeper with “New Analytics”
4. Run the New Analytics “Course Activity” report, monitor discussion activities
5. Follow the weekly pulse of your course with “New Analytics”
6. Review high level access of essential course documents with “New Analytics”
Building expertise by analyzing log file exports
7. Find out which resources were accessed most frequently
8. Find out when resources were accessed
Getting Started
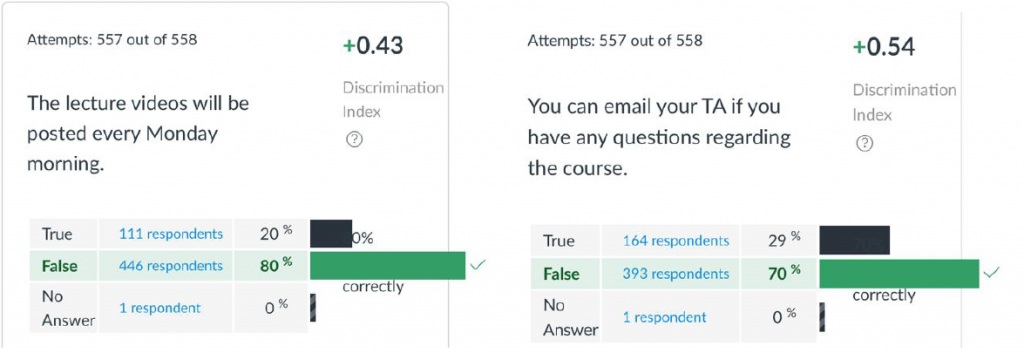
1. Use On-the-fly synchronous knowledge checks
During a synchronous lecture, ask your students to take short Quercus knowledge check quizzes. From the quiz set up page, use the Quiz Statistics report to access detailed, on-the-spot assessment of student learning. Look for this link/function on the right side of the instructor view:

Example screenshot from a course/prof using a knowledge check quiz activity in a large course:
2. Using the standard dashboard to “View Course Analytics”
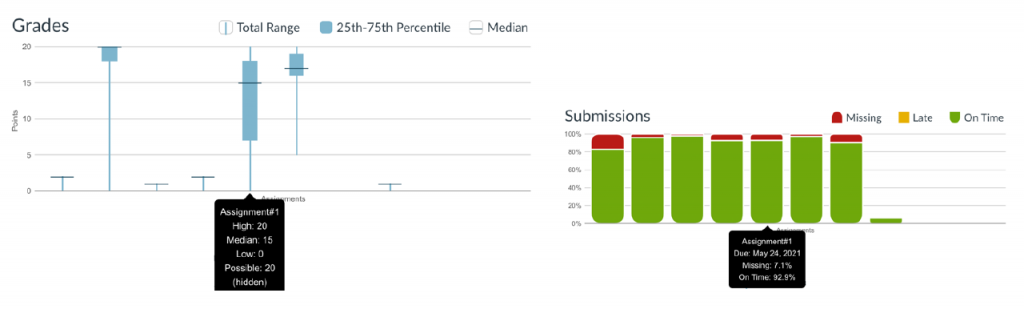
By default, a course analytics dashboard is enabled in all courses. Use these tools for a general sense of course activity, grades and completion of assignment.
Example screenshots of quick visualizations of grades, submissions per assignment:
Aggregate views of data:
3. Enable “New Course and User Analytics” feature
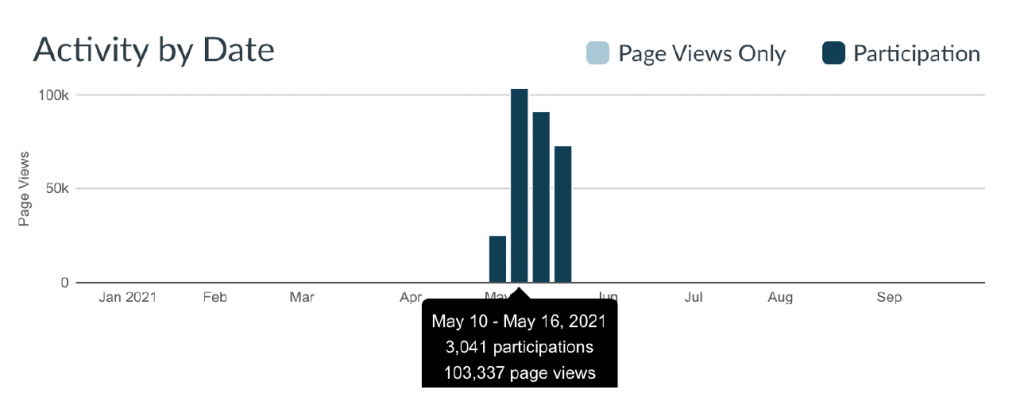
Using the more advanced dashboard, view the activity patterns such as weekly page views to get a general sense of engagement
Example screenshot of average course activity (blue) compared against activity in a particular tutorial group:
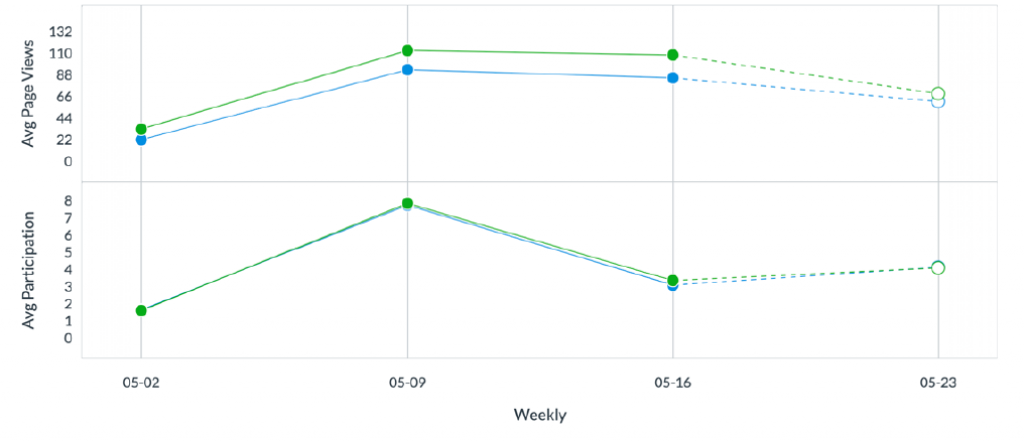
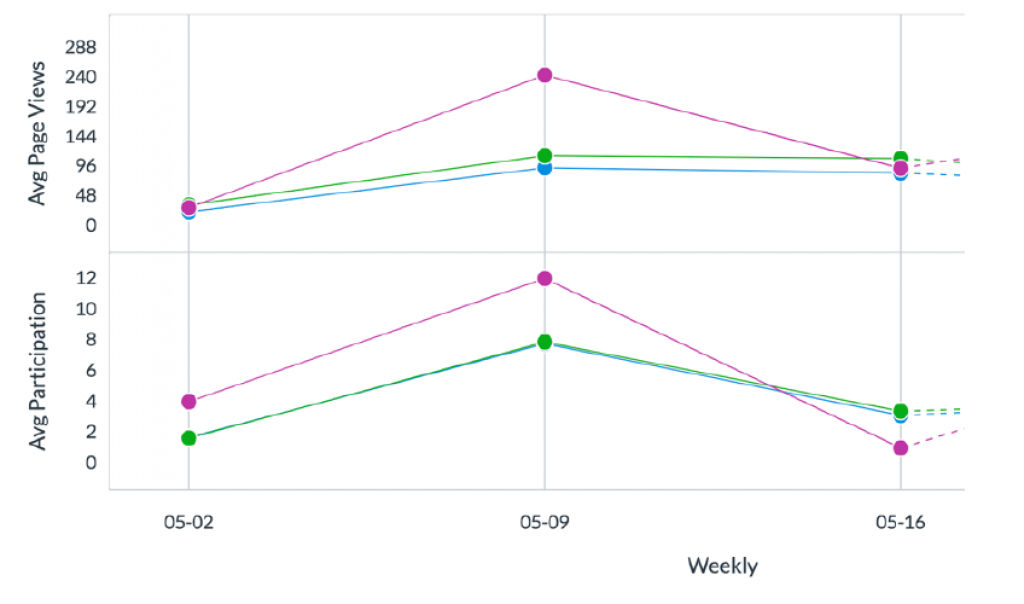
In this example, individual student activity (purple) can be shown relative to the course or section.
Digging deeper with “New Analytics”
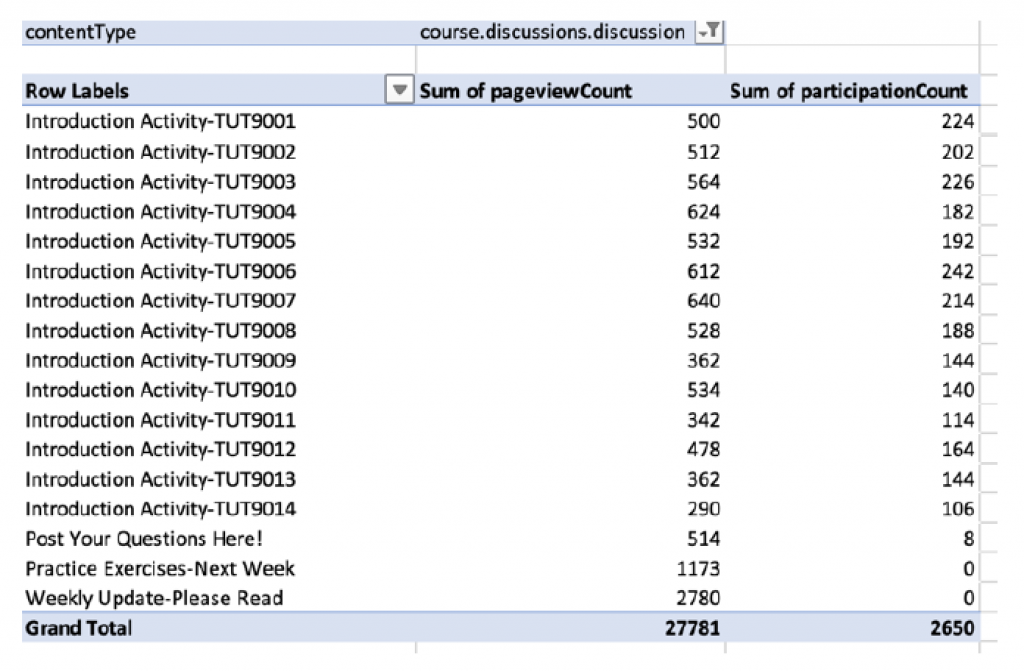
4. Run the New Analytics “Course Activity” report, monitor discussion activities
Under New Analytics Reports tab, select “Course Activity” to download a full detailed log report to Excel. Create a Pivot Table with contentType as a filter=“course.discussions.discussion”, contentName as rows, Sum of pageviews and sum of participations as Values. View relative engagement for across tutorial groups or discussion topics:
Example screenshot shows page view and participation counts.
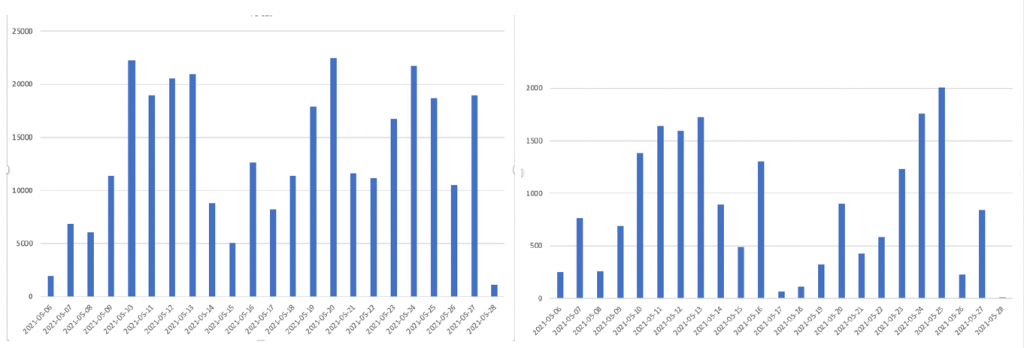
5. Follow the weekly pulse of your course with New Analytics
Under New Analytics Reports tab, run Course Activity – and download full report to Excel. Create a Pivot Table with startDate as rows, Sum of pageviews as Values or Sum of participations.
Example screenshots show Values (left) and Sum of participations (right).
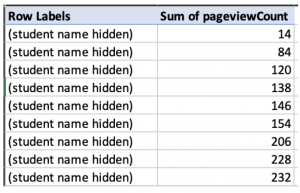
6. Review high level access of essential course documents with New Analytics
Under New Analytics Reports tab, run Course Activity – and download full report to Excel. Create a Pivot Table with contentName = “*” as a filter (whatever you want to track, e.g. Course Home), studentName as rows, Sum of pageviews as Values. Then sort from smallest to largest. You’ll see the names of any students who have accessed the least number of times.
Building expertise by analyzing log file exports
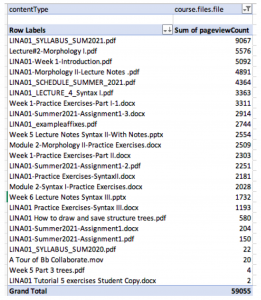
7. Find out which resources were accessed most frequently
Under New Analytics Reports tab, run Course Activity – and download full report to Excel. Create a Pivot Table with filters and contentType = “*” (course element to track, e.g. for course Files select ‘course.files.file’ and for pages select ‘course.pages.page), contentName as rows, Sum of pageviews values.
Example screenshot shows data sorted from largest to smallest:
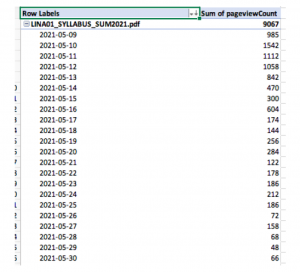
8. Find out when resources were accessed
Analyze when the resources were first accessed through addition of start Date to the pivot table rows.
Example screenshot shows combined pivot table: