[*New – Phase 2 Project Activity Update]
[Phase 1 Project Activity Update]
The University of Toronto launched an initiative to advance recommendations identified in the learning analytics strategy paper published by the Office of the Vice-Provost Innovation in Undergraduate Education (VP-IUE). The first project, Quercus Instructor-Facing Dashboard, addresses the identified need to extend existing analytic tools within the university’s core learning environment. To better support instructor and staff access to learning analytic data, the focus is on planning improvements to Quercus core reporting functionality to enhance instructional quality and evidence-based planning. This project advances planning for the first of a series of data visualizations or tools within a dashboard model that instructors can use to inform course design and teaching practices.
![]()
Primary activities of the project include:
* Environmental scan to investigate work at peer institutions using Canvas and/or third-party service providers for viable options to build, adapt or purchase services. [Fall 2021]
* Articulation of priority functions based on input from a Learning Analytics user table in combination with other key stakeholder feedback. [Winter 2022]
* Report to the Learning Analytics steering committee on implementation options to advance project goals. [Spring 2022]
* Interface design and instructor support planning [Fall 2022]
These activities are occurring in parallel, and in coordination with, other projects within the broader VP-IUE’s Learning Analytics Initiative for the University of Toronto, in particular development of a Quercus Record Store and related infrastructure for managing access to learning data assets.
Phase 2 Project Activity Update
August 08, 2022
Interface Design and Instructor Supports
We are beginning phase 2 of the learning analytics instructor facing dashboard design planning. For phase 2 the focus will extend to include the overall journey and user experience of the instructor-facing learning analytics dashboard components, as well as the supporting dashboard environment. Building from the user personas and use cases gathered from phase 1, this work includes conceptualizing the dashboard integration into the CTSI web space and developing a mock-up that:
- Defines and provides context for using learning analytics at UofT
- Refines UI design to support access and manipulation of the permitted Quercus record store data
- Supports users making meaning from and visualize the data
- Provides a pedagogical “wrapper” for informed and actionable use of the dashboard data
- Provides additional references to support resources and faculty development opportunities to optimize self-directed use of the dashboard and/or faculty development programs.
As the Quercus Record Store as a source of data and related Power BI infrastructure is continuing to be developed, in this phase we propose to identify priority web content components and prepare draft web space design integrating functional needs and supports to frame instructors’ course data access from the QRS.
These activities will take place during the fall term, with a goal of meeting key milestones by December 2022.
Phase 1 Project Activity Update
June 13, 2022
Scoping and Requirements Articulation
To ensure that we captured the diversity of instructor needs across the three campuses, more than fifty user stories were collected from several different sources:
- Learning Analytics User Table with faculty and administrative representation from over 11 divisions across the three campuses undertook a group process to formulate user stories and document requirements.
- Academic Toolbox Reference Group are faculty leaders with expertise in the area of digital learning who were engaged for feedback on draft requirements.
- Data-Driven Design: Quercus Analytics (D3:QA) cohort of instructors participating in a peer network that is prototyping Quercus learning data analytic methods to improve course design.
Insights from all of these sources have been used to translate high-level priorities participants identified into specific functional requirements that will be reflected within these dashboards. The results were themed with four areas of exploration emerging. Of the many suggested areas for exploration, the two most highly ranked priority areas were the following:
- Student Activity / Progression – Ability to track the type of activity throughout the term (e.g., number of clicks by day & by resource).
- Student Assessment – Relationship between activity and course performance (e.g., average number of visits by week and course mark).
Our initial explorations will focus on the Student Activity/Progression requirements, which was the area of analysis and reporting that was most highly requested by the instructor community. Draft documentation of functional requirements for data access, filters and reports for this dashboard theme area of has now been made available to the Quercus Record Store development team.
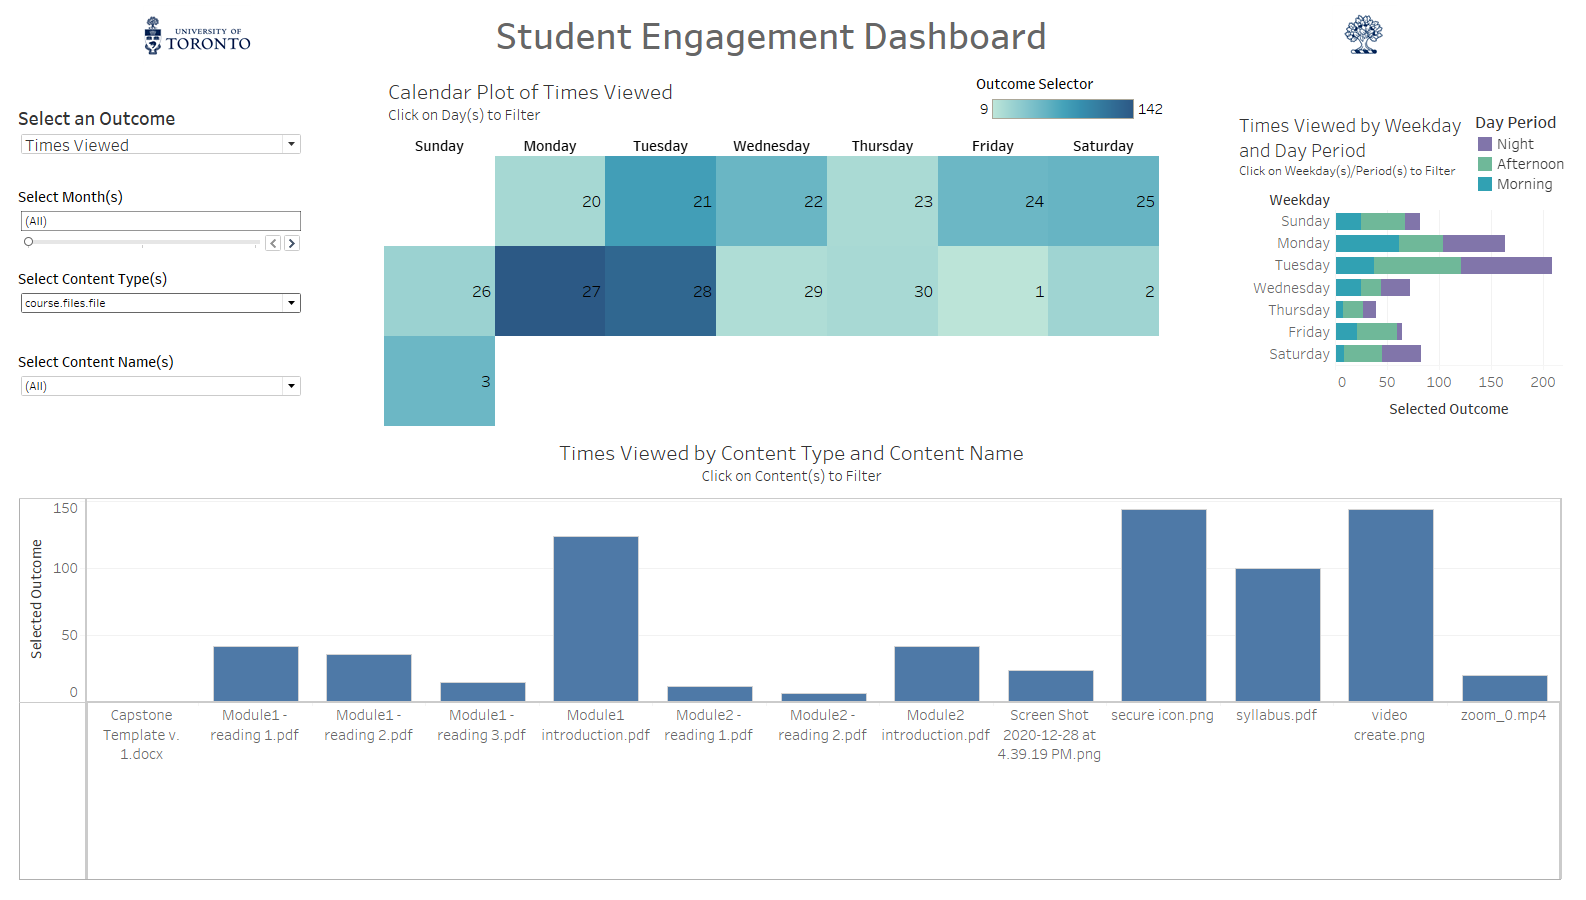
Dashboard Prototypes
Alan da Silveira Fleck, Data Analyst, Learning Analytics, has been developing functional dashboard prototypes to support visualizations of dashboard components based upon available Quercus course data. Currently at the core development phase, these examples provide starting points for ideation on possible UI design for the instructor facing tools. Utilizing existing downloadable course activity reports from Canvas New Analytics and employing Tableau, an analytics management platform, Alan has created a series of example solutions to explore and visualize course data with ease.
Based on the user table recommendations, below are some of the potential dashboard solutions developed to date. As this initiative advances with the development of core learning record store infrastructure we will be able to move to more complex analytic tools in Phase 2.
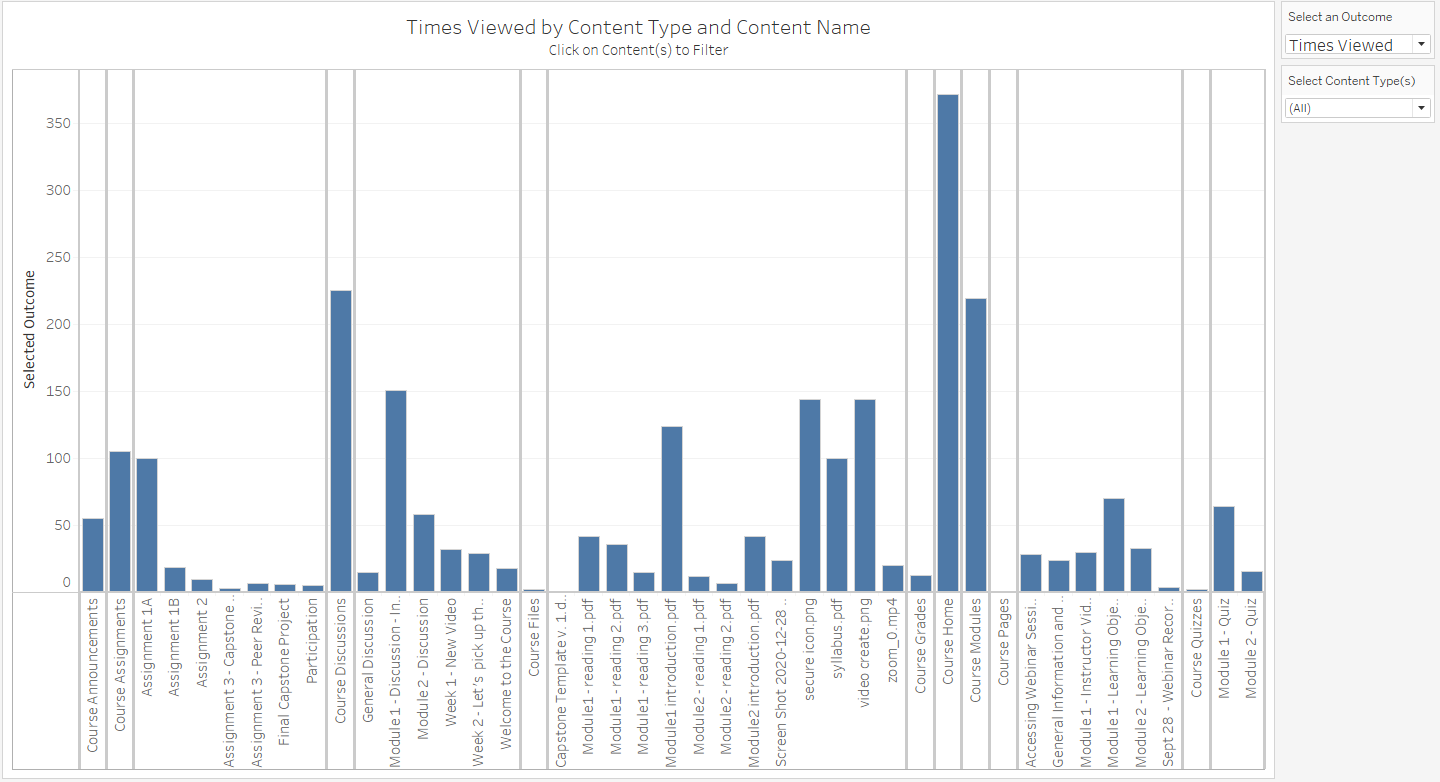
Times viewed by content type and content name
Users are able to sort and visualize how many total times individual content items have been viewed (modules, pages, files, quizzes, assignments and discussions are included).
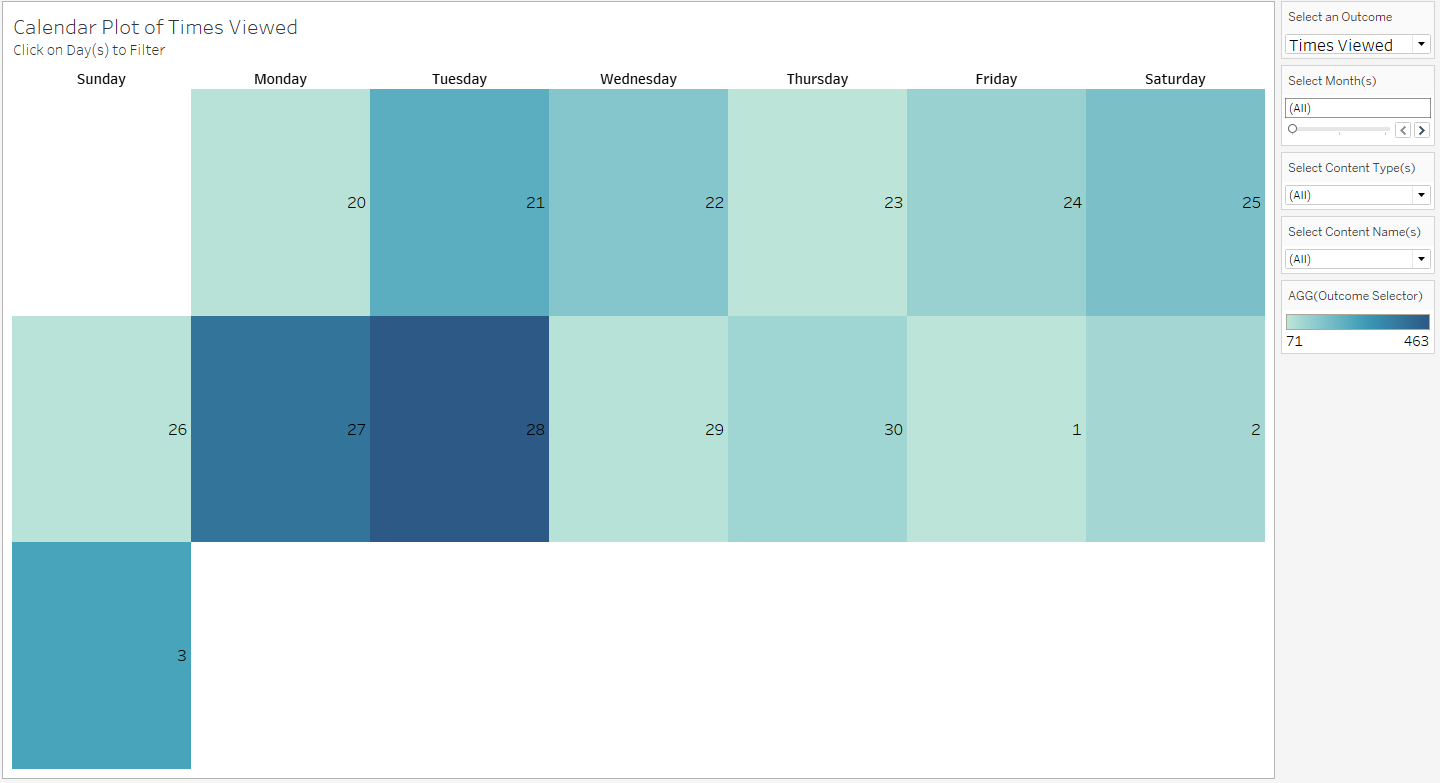
Calendar plot of times viewed
Users are able to sort and visualize item views and participations according to the day of the week, applied to a standard calendar.
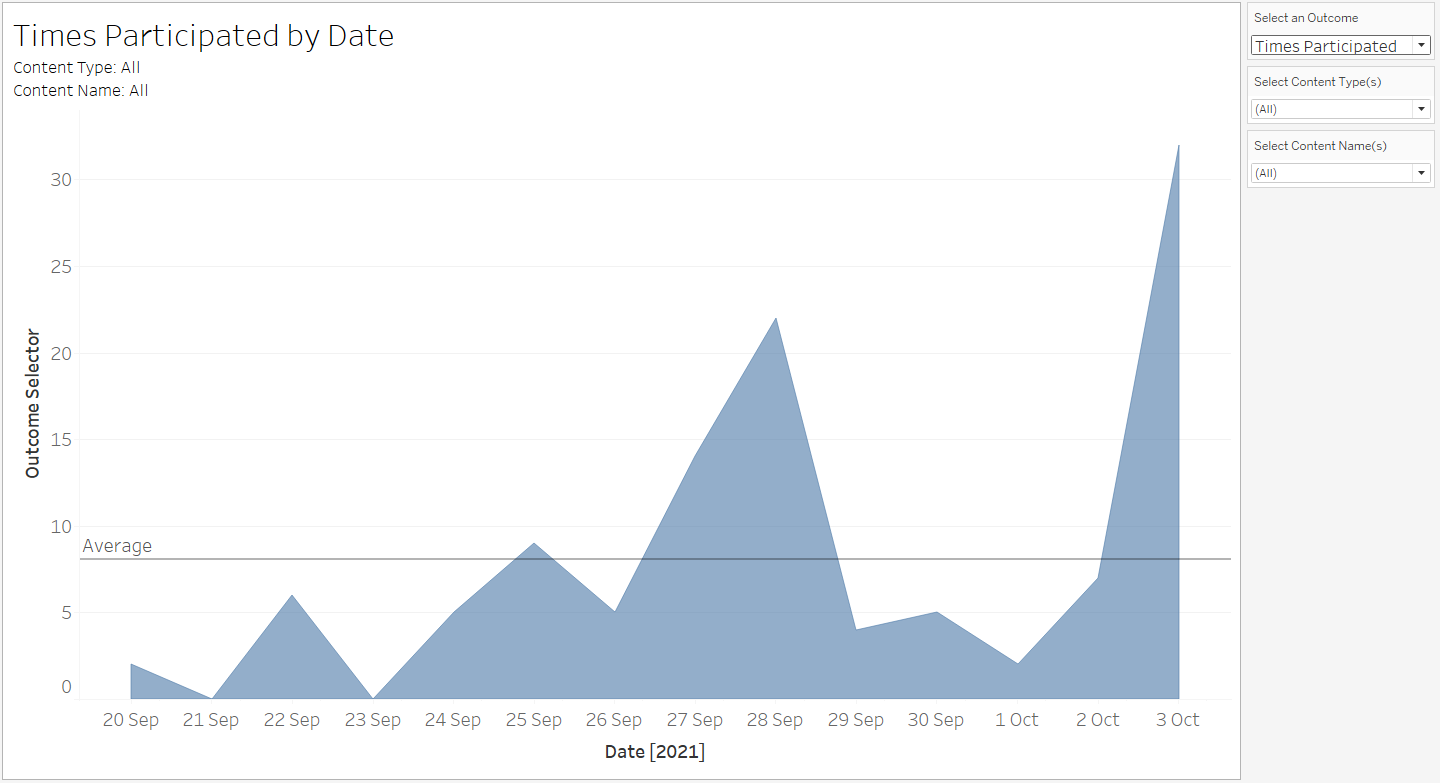
Times participated by date
Users are able to sort and visualize how many participations with a content item have occurred and references participation to a specific date (quizzes, assignments and discussions are included).
Full Student Engagement Dashboard
Phase 1 Report
A report to the Learning Analytics steering committee on implementation options for consideration is now available. Read the Quercus Instructor-Facing Dashboard – Phase 1 – Summary Report.
Project Team
- Laurie Harrison – Director, Digital Learning Innovation
- Lauren Hudak – Special Projects Officer, Office of the Vice-Provost, Innovations in Undergraduate Education
- Alan da Silveira Fleck – Learning Data Analyst, Centre for Teaching Support & Innovation
- Will Heikoop – Coordinator, Digital Learning Innovation
- Marco Di Vittorio – Manager, Application Administration, Academic & Collaborative Technologies
- Avi Hyman – Director, Academic & Collaborative Technologies
————
Follow this page for updates on progress.
Contact digital.learning@utoronto.ca for more information.
[Image by pxfuel]