Demographic Report on University of Toronto Coursera MOOCs
June 16, 2013
Background
In order to support MOOC-related research and evaluation processes, the Office of Online Learning Strategies is involved in administrating access to detailed user data sets from Coursera and cleaning it for analysis. The data is being stored centrally and made available for a range of purposes, including institutional planning processes. It will also be used in a research study among five MOOCs that launched between January and May 2013. The course instructors are all co-PIs on the ethics proposal, and will share the analytics data. For a full description of activities visit: Open Utoronto MOOC Research and Evaluation.
The data
In addition to the intro- and exit-surveys, for students who choose to respond, we also have access to learning analytics data for all students in the chosen courses, including when students log on, their activity, their success at quizzes, etc. The data is anonymized, but we are able to link intro- and exit-surveys with student activity for each individual student. The co-PIs are planning to explore the relationships between different variables, but for this initial institutional report, we are simply reporting some of the key variables from the intro-survey.
The survey
A generic intro- and exit- survey was developed, and offered to students in all courses (with some additional questions and categories for specific courses). This survey, with adaptation as appropriate, will be used in all future UofT MOOCs. Due to the timing of the ethics proposal, the survey was offered to participants in The Social Context of Mental Health and Illness, and Aboriginal Worldviews and Education quite late in the course, which can explain the low response rate.
Courses
| Course name | Instructor(s) | Enrolment | Intake survey response rate |
| The Social Context of Mental Health and Illness | Charmaine Williams | 22,500 | 6% |
| Aboriginal Worldviews and Education | Jean-Paul Restoule | 20,600 | 8% |
| Learn to Program: Crafting Quality Code | Paul Gries Jennifer Campbell |
54,700 | 17% |
| Statistics: Making Sense of Data | Allison Gibbs Jeffrey Rosenthal |
51,500 | 34% |
| Introduction to psychology | Steve Joordens | 60,700 | 32% |
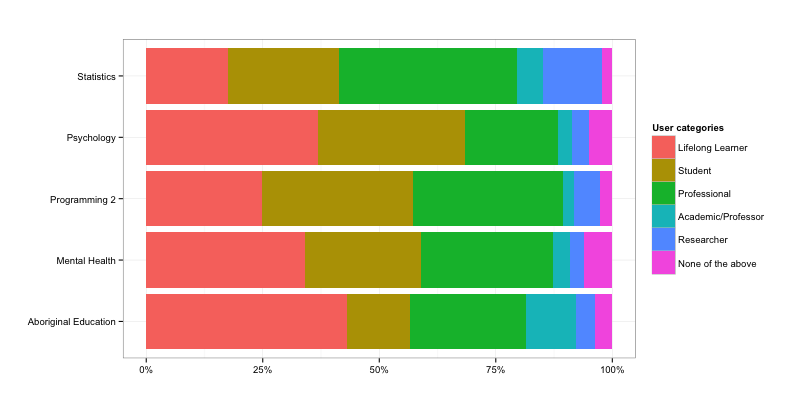
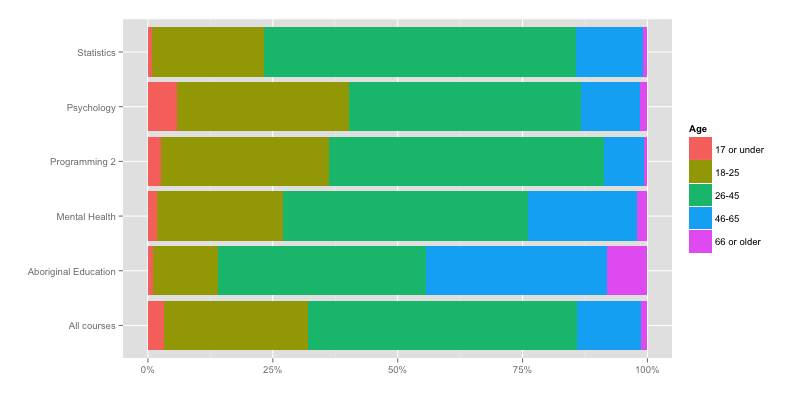
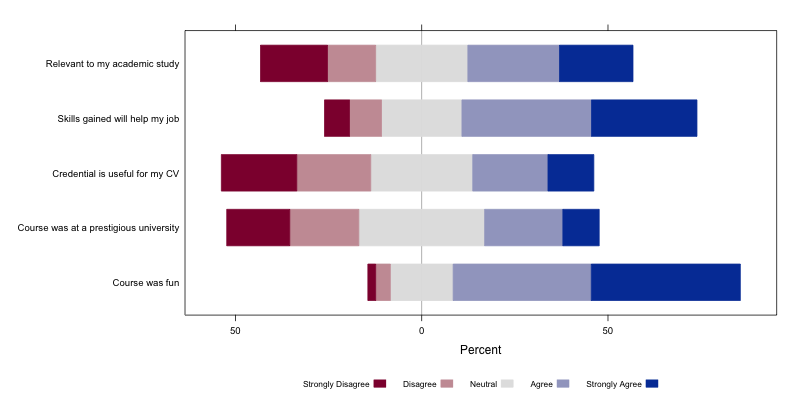
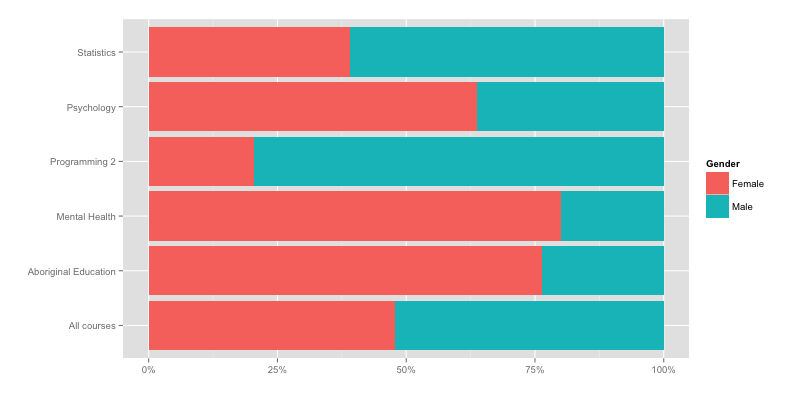
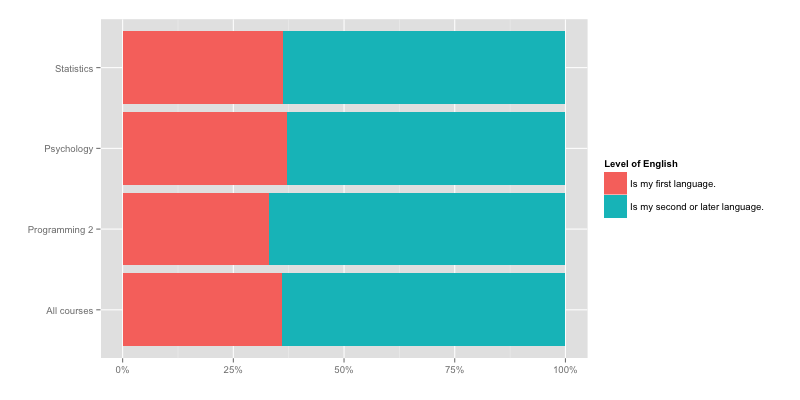
Tables reflecting summary data collected intro surveys for these five MOOCs are provided below. For more information contact Stian Haklev, Institutional Researcher for the Open Utoronto initiatives.
User categories
Education levels
Age groups
